Not Enough Mines…So Data Mine
James Cormier-Chisholm,
P.Geol., B.Sc. Geology, Env. Dipl., MBA
Owner, Eureka Maps Inc.
Draft Submission to CMJ: Feb 24, 2022
Words 1952
Eureka Map Inc.
Bio : James
Cormier-Chisholm is a Nova Scotia geologist who owns Eureka Maps Inc., a
geological data mining company. He became
interested in data mining after working on the Voisey’s Bay Nickel Project as a
consultant reviewing the mine and refinery complex for the Canadian Federal government
in 1998 to 2000. He worked as a financial writer data mining markets for
Futures Magazine, a US based trade magazine, defined the Exxon Mobil heavy oil
mine resource using data mining techniques, and worked in the environmental
field on megaprojects, including as a fund knowledge worker reviewing financial
and environmental considerations for megaproject funding, underneath Dematteo
Monness. He has actively worked on projects as an environmental manager on
infrastructure megaprojects, and as an environmental EIA reviewer and auditor
consultant one of the world’s largest infrastructure projects with KBR.
email:
jamescormierchisholm@eurekamapincorporated.com
1.
Not Enough Mines…So Data Mine
1.0 Introduction
The world economy needs a massive injection of base metals to enable it to convert from an oil and gas economy to a sustainable economy (See Fig. 1).

Demand
side metal projections are high. BHP estimates copper demand for
battery-powered electrical vehicles (EVs) will need 80 kilograms of copper,
four times as much as an internal-combustion engine. BHP forecasts by 2035
there could be 140m EVs on the road (8% of the global fleet), versus 1 million
today.[i] BHP projects 8.5 million tonnes more
copper needed, a third more copper than today’s total global copper demand.
Nickel demand for EV battery manufacturing projections show growth of 29% per
annum until 2030.[ii] Estimates
show Tesla alone, before we add in all the other automotive companies moving
into electrical vehicles, buying all the output of top producers: Norilsk,
Vale, Jinchuan, Sumitomo, Glencore, and BHP.[iii]
To
enable this mining boom investors and explorationists need a present-day
exploration effort that leverages existing data to increase odds of exploration
success and massively shorten the time required to open new mines.
Inflationary
pressures mean gold and base metal mines will be in strong demand for years to
come. This article illustrates an accurate
data mining approach applicable to finding and developing new metal mines, with
lower upfront costs, reduced risk and time in getting to market.
1.1 Present Situation in Mining
Exploration
Present
mining exploration consists of drilling geophysical anomalies identified by
various geochemistry and geophysical techniques. This current process is slow, expensive, and
risky and is not finding and producing enough mines:
(a) Prospectors & Developers
Association of Canada (PDAC) calculates the odds of finding a mine from exploration
to mine(s) commercialization as 0.01%. [iv]
(b) The very low odds of successful
exploration mean mines are harder to find and thus take years to find and
develop with typical quoted time lags for exploration to opening a mine of 15-years. The odds continue to get worse, and the
supply of new mines is plunging. Between 1983 until 2020, there has been a 67%
drop in mines the USA, and between 2011 to 2020, there has been a 32 % drop in
new gold mines, and a 57 % drop in new base metal mines worldwide (See Fig 2
and Fig 3).


1.2 The Horse & Jockey: Geological
Data and Exploration Companies
Industry
and governments approach this exploration time lag issue like a gambler at a
horse race who gathers data about each horse and jockey. The “horses” are various types of geological
data being gathered, and the “jockeys,” are companies with skill levels
to ride a resource race. This horse and
jockey data gathering approach is done to find out what works to find deposits,
and who best finds economic mines. Horses
alone carry the jockeys, but it is horses – the geological data – that win the races.
1.2 Help…It’s Geological Data!
Thousands
of terabytes of data to “help” with a low odds exploration success process is
piling up. Until recently, no one took a look at all this public data, from a
data mining perspective, to find what works and does not work, using a
supercomputer capable of looking and finding economic deposits across vast areas.
Existing
exploration companies take a balkanized exploration approach. Some explore only next to old mines in mining
districts. They anticipate luck will rub
off from those old mining district deposits. Greenfield explorationists have PDAC’s odds. [We have nothing against both approaches
– we wish them well. But this hasn’t
stopped a decrease in new mines (Fig. 1 and 2, previous).
The
Eureka Maps Inc. (Eureka) approach: look for ore deposits both around old
deposits, and in entirely new places, using data mining algorithms that scale to a planetary
level. The Eureka approach presents opportunities
for novel discoveries of ore bodies at a different scale, the planet.
1.4 Crystal Ball
The
techniques include decision tree algorithms, solving both regression and
classification problems to high accuracy levels. Decision Trees create a training model that
predicts the class or value of the target variable by learning simple decision
rules inferred from prior data (training data). Decision Trees, for predicting
a class label for a record start at a root of the tree. Algorithms compare
values of the root attribute with the record’s attribute. On the basis of
comparison, branches corresponding to a value are then added and then jump to
the next node while improving the overall algorithm fit to the dataset. Test confusion matrices are then run on new
known data predicting the accuracy of decision trees. Actual ground truthing by
assay, using various methods, on predicted deposits, then follows, providing a
data miner’s version of geological ground truthing.
Decision
Trees come in two broad flavors:
(1) Categorical and\or binary
decision trees train on a categorical target variable or binary targets, in
our case, economic levels of minable deposits across wide areas of exploration
as these algorithms can handle both various statistical distributions and
ground faults.
(2) Regression algorithm style
decision trees work on continuous grade variables, similar to kriging, i.e.
ore grade changes. Regression algorithms are applicable on specific
ore body statistical distributions within fault boundaries.
Our
approach to wide area exploration focuses most on flavor 1 above. It is an approach developed over many years. Following
an MBA data mining thesis in 1999 on predicting silver commodity markets, we applied financial MARs model results to predict
trade markets for Futures Magazine (For a 500K readership of main market commodities
trader magazine). In 2003, we published a BC Canada, province wide exploration
decision tree data mining prediction result for high production oil and gas
wells in The Oil and Gas Journal.
This was the first time a data mining technique applied to exploration
in geology was published. In 2004, geological
data mining work on Exxon Mobil’s $12.5-billion program revealed three deposits
within a 50 km2 study area.[vi] These deposits today are working
heavy oil sand mine at Kearl Lake, Alberta, Canada. The underground
visualization aspect of work was published in The Oil and Gas Journal in
2008.[vii] In 2020, accuracy of our results placed us in
the top tier out of 2,200 other data mining teams in the South Australia Gawler
Craton government sponsored contest. Between
2020, until present, this approach was scaled up using a supercomputer to
planetary level searches for gold, nickel, and copper metals.
What does the resulting data mined metal classification look like? We concentrate on gold in the next page. First example is a 10 grams per tonne classification for gold in South Nova Scotia, as compared to a simplified geological picture (See Fig. 4). Note, data mining results should be confirmed with follow up ground truthing.[


This
approach also works to expand on resource discovery around brownfield
situations, such as the Rawdon Mine, last worked in 1934 (See Fig. 6, next
page).
An interesting point: the data mining algorithm shows a folding rock pattern of ore bodies typically found in quartz in metasedimentary rock of Meguma Group geology which is associated with high grade visible gold in Nova Scotia (Fig. 6). The data mining algorithm has independently discovered a deposit shape at Rawdon Mine that geologists in Nova Scotia are familiar as an observed deposit fold shape that holds visible gold in quartz.
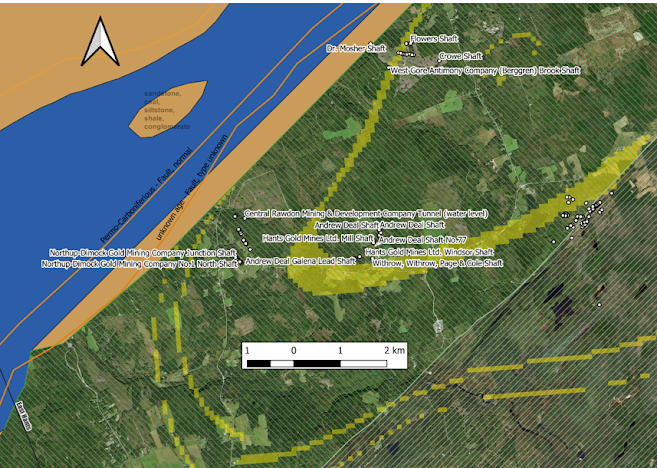
Figure 6 Rawdon Gold Mine
1.5 What to Expect with Better
Exploration Forecasting?
There
will be a much shorter lag time from exploration to commercial mines with the
improved forecasting of deposits. A more accurate method to forecast mines means
much shorter lag times for mine development.
Exploration
programs under traditional methods for base metals have a 15-to-20-year lag
period at 0.01 odds of finding a mine. The lag time is expected to be less than
5-years for prospected resource to mine development for base metal mines, using
a method that gets drilling programs onto the resource quicker, and funding,
when combined with the NI 43-101 process which requires a company to file a
technical report at certain times, prepared in a prescribed format.
Conclusion
To
meet the upcoming sales curves for electrical vehicles, and the conversion of
our mining industry to an industry that can support this oil and gas to battery
economy conversion, we need far more metals.
Supercomputer level data mining across wide areas is Eureka’s way to meet
upcoming metal base metal demand. We
suggest it drops exploration to commercial mine developments for base metals
mines down to under 5 years, rather than a 10-to-15-year development cycle for
exploration to commercial mines.
[i]
Unknow writer, Mining Companies have Dug themselves out of
a Hole, The Economist, Mar 11th, 2017, Edition, found
at:
https://www.economist.com/business/2017/03/11/mining-companies-have-dug-themselves-out-of-a-hole
[ii] Carbon
Intensity Emissions Curve for Nickel Producers, 2021, found at: https://www.visualcapitalist.com/visualizing-americas-electric-vehicle-future/
[iii] Els,
Frik All the Mines Tesla Needs to Build 20 Million Cars a year Mining.com,
Jan. 27, 2021, Found at: https://www.mining.com/all-the-mines-tesla-needs-to-build-20-million-cars-a-year/#:~:text=Tesla's%20models%20use%20on%20average,nickel%20(NCA%20and%20NCM811).
[iv]Prospectors
and Developers of Canada, found at:
https://www.pdac.ca/priorities/access-to-capital
[v]Author
Unknown, Selecting an AutoAI model (Watson Machine Learning),
IBM, found at: https://www.ibm.com/docs/en/cloud-paks/cp-data/3.5.0?topic=autoai-selecting-model
[vi] Cormier-Chisholm,
J., C., Sebastian, Gas well development through decision trees,
Oil and Gas Journal, Jan. 20, 2003, found at:
https://www.ogj.com/exploration-development/article/17240107/gas-well-development-through-decision-trees
[vii] Chisholm,
J., Voxel Volumetric Visualization Aids Oil Sands Production Optimization,
found at: https://www.ogj.com/general-interest/companies/article/17218438/voxel-volumetric-visualization-aids-oil-sands-production-optimization

Comments
Post a Comment